The Backbone of Data-Driven Decision Making
Understanding Power BI Architecture: A Comprehensive Overview
Reporting Architecture: The Backbone of Data-Driven Decision Making
Reporting architecture is the framework that transforms raw data into actionable insights, empowering organizations to make informed decisions. It integrates data from a variety of sources, including databases, APIs, cloud platforms, and data streaming tools like Kafka. This architecture ensures that data flows seamlessly through three core stages: connection to data sources, analysis within visualization platforms like Power BI and Tableau, and the dissemination of insights across teams and decision-makers. At its heart, reporting architecture combines robust integration processes (ETL/ELT), scalable storage solutions, and intuitive visualization tools, ensuring that organizations can extract, analyze, and share meaningful information. Among these tools, Power BI stands out for its ability to unify these elements, offering a cohesive environment for creating reports and dashboards that bridge the gap between raw data and strategic insights.
Understanding Power BI Architecture: A Comprehensive Overview

Introduction: Bridging On-Premises and Cloud Data Analytics with Power BI
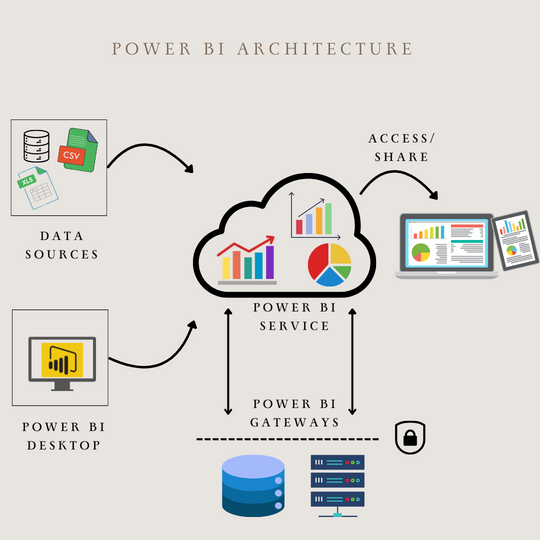
Power BI exemplifies modern reporting architecture by seamlessly integrating on-premises and cloud-based systems to cater to diverse organizational needs. Its dual deployment options—Power BI Report Server for on-premises environments and the Power BI Service for cloud-based reporting—enable businesses to balance security, governance, and accessibility. The Report Server, a specialized version of SQL Server Reporting Services, allows organizations to host and share reports locally, maintaining strict control over data while leveraging robust compliance measures. In contrast, the Power BI Service functions as the cloud backbone, supporting advanced features like real-time analytics, collaborative dashboards, and dynamic visualizations. Its architecture integrates a front-end web interface for user management and content distribution via Azure Content Delivery Network (CDN) with a back-end infrastructure powered by Azure SQL databases, block storage, and real-time updates. Secure connections to on-premises data are facilitated through Power BI Gateways, while Azure Service Bus ensures seamless data movement.
Power BI Desktop: The Engine of Data Preparation and Modeling
Power BI Desktop provides robust tools for cleaning, transforming, and modeling data, enabling users to create visually impactful reports that can be published to the Power BI Service or Power BI Report Server. Its versatility extends to connecting with diverse data sources, including file-based formats like Excel and CSV, databases such as Snowflake and SQL Server, and Power Platform tools like Power Apps. Additionally, Power BI integrates seamlessly with Azure services like Azure SQL Database and Blob Storage, online platforms such as Dynamics 365 and Salesforce, web APIs, Google Sheets, and Spark, allowing for comprehensive data consolidation to drive insights. A critical aspect of report design and maintenance is selecting the appropriate connection type, which influences how data is refreshed and accessed.
-
Import Data: Performance and Scheduled Refresh:
The Import Data method loads data into Power BI’s in-memory model, ensuring fast performance and allowing advanced features like data transformations, DAX calculations, and combining multiple sources. However, updates require scheduled refreshes to ensure data accuracy. This approach is ideal for smaller datasets or scenarios where speed and flexibility are essential, though size constraints may arise without Power BI Premium.
-
DirectQuery: Real-Time Updates with Trade-Offs:
DirectQuery connects directly to the data source, eliminating the need for scheduled refreshes as reports always query the most current data. This method supports massive datasets, limited only by the source system’s capacity. However, it comes with reduced performance and restricted functionality, such as limited modeling features and slower visualizations due to database reliance. DirectQuery is best suited for real-time analytics when immediate updates outweigh flexibility needs.
-
Live Connection: Large-Scale Models and Analytical Power:
Live Connection offers a hybrid approach by connecting Power BI to Analysis Services data sources, including Azure Analysis Services, SQL Server Analysis Services Tabular, and Multi-Dimensional models, as well as Power BI Service Datasets. Like DirectQuery, it doesn’t store data in memory, ensuring queries pull the latest data. However, it differs by leveraging the analytical engine of SQL Server Analysis Services Tabular, enabling large-scale models with the added benefit of advanced analytical capabilities of Analysis Services. Live Connection is ideal for organizations utilizing Analysis Services for its scalability and robust modeling.
Power BI and Kafka: Enabling Real-Time Reporting
Power BI and Kafka serve complementary roles in modern data architectures: Kafka facilitates streaming real-time event data, while Power BI specializes in structured data visualization and analysis. Although Power BI does not directly integrate with Kafka, Azure Event Hubs acts as a Kafka-compatible bridge, enabling the ingestion of event streams for downstream processing. Using Azure Stream Analytics, the data is transformed and aggregated into structured formats that Power BI can process. This architecture supports real-time reporting by combining Kafka’s event streaming, Azure’s processing capabilities, and Power BI’s interactive dashboards to deliver actionable insights.
Power BI and Enterprise Architecture Tools
Power BI integrates seamlessly with enterprise architecture tools like Essential Cloud, ADoIT, or LeanIX, leveraging APIs to access and visualize data from the enterprise meta-model. By utilizing current data such as processes, organizational units, applications, interfaces, technology modules, and responsibilities, organizations can gain deeper insights into their operational and technological landscape. This integration enables Power BI to answer critical questions, such as identifying legacy software still in operation, determining responsible stakeholders, or analyzing the pace of technological transformation.

Kai Herings
Senior consultant
Optimize alignment between IT and business with expert advice and clear strategies.
